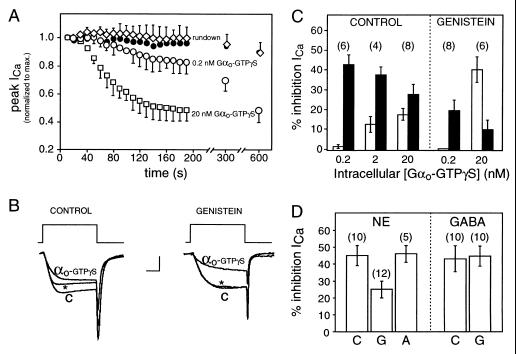
Figure 4.
GABA-induced steady-state inhibition is mediated by Gαo. (A) Time course of Ca2+ current during intracellular application of Gαo-GTPγS (0.2 nM, ○, n = 6; 20 nM, □, n = 8), Gαo-GDP (20 nM, •, n = 3), or control internal solution without Gαo (“rundown,” ⋄, n = 4). Data plotted as means ± SEM; one-sided error bars are plotted for clarity. (B) Three superimposed current traces evoked by 10-ms step depolarizations to 0 mV from a holding potential of −80 mV. Shown are the relative proportions of kinetic slowing and steady-state inhibition produced by 20 nM intracellular Gαo-GTPγS in control cell (Left) and cell exposed to 100 μM extracellular genistein (Right). Control currents (C) were taken within 20 s of achieving whole cell access (before Gαo-GTPγS inhibited the current). Inhibited currents (measured after 5 min of exposure to intracellular solution containing Gαo-GTPγS) were evoked either without (αo-GTPγS) or with (∗) a depolarizing conditioning pulse (not shown) to reverse kinetic slowing. Calibration: 0.75 nA (Left), 1 nA (Right), 5 ms. (C) Mean inhibition of Ca2+ current produced by intracellular application of recombinant Gαo-GTPγS at the concentrations indicated on abscissa; kinetic slowing (empty bars) and steady-state inhibition (filled bars) in control cells or cells exposed to 100 μM genistein in the bath (as indicated). (D) Mean inhibition of calcium current produced by 100 μM GABA or NE in control cells (C) or in cells exposed to 100 μM intracellular βγ-binding peptide G (G) or peptide A (A) of the same length but without βγ binding activity. Errors represent SEM in all panels (n in parentheses).

