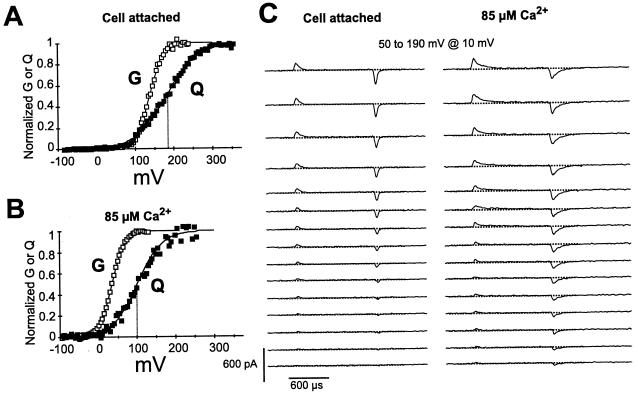
Figure 3.
Micromolar Ca2+ shifts Q–V and G–V curves. (A and B) Comparison of Q–V and G–V curves in the cell-attached mode and in 85 μM Ca2+ in the same cell. Data points were obtained and fitted as in Fig. 2. Dotted lines mark V½ values for Q–V curves. Fitted values were as follows: for cell-attached, V½ − G = 137 mV, zG = 1.4; V½ − Q = 180 mV, zQ = 0.6; for 85 μM Ca2+, V½ − G = 35 mV, zG = 1.5; V½ − Q = 100 mV, zQ = 0.7. (C) Corresponding gating current records in cell-attached mode (≈100 nM Ca2+) and after excision of the same patch in 85 μM free Ca2+. SHP = −120 mV. Solutions and pulse paradigms were as in Fig. 2.

