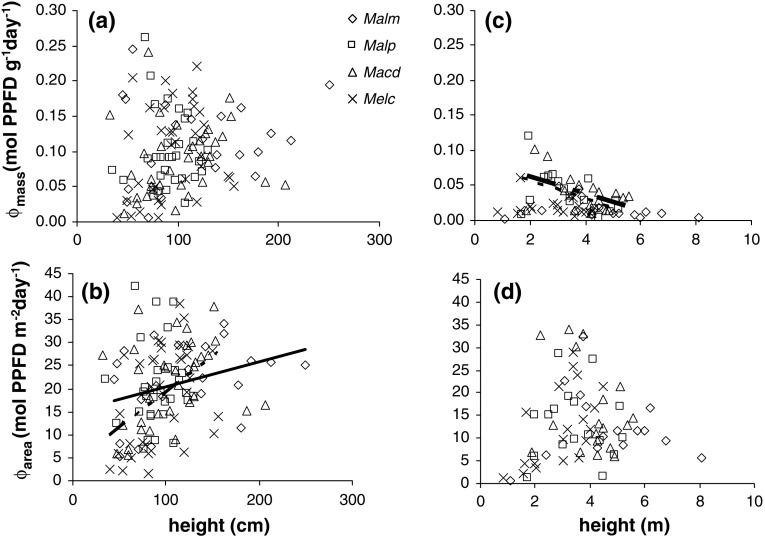
Fig. 5.
Relation between Φmass and daily light capture per leaf area (Φ area) and individual plant height in stages III (a, b) and IV (c, d). In b and c the regression lines indicate a significant relation (b solid line for Malm, broken line for Melc; c dashed line for Malp, broken line for Macd). Abbreviations: see Fig. 2

