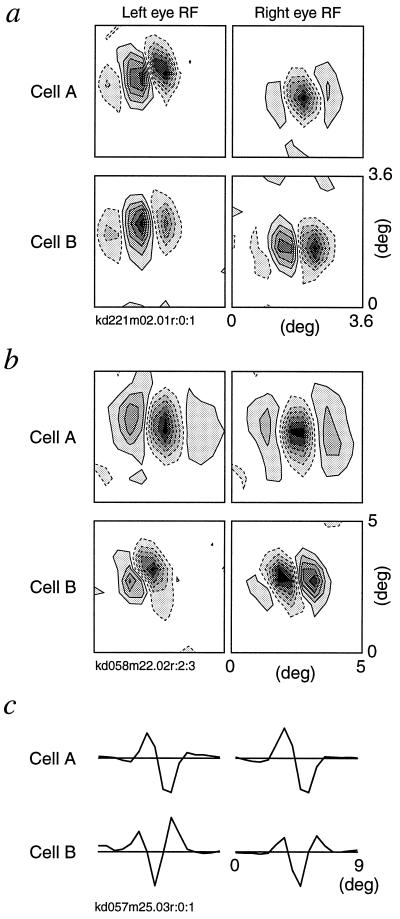
Figure 4.
Examples of left and right RF maps for a pair of simple cells recorded simultaneously. The RF map of each eye is shown separately for each cell for clarity. Reference cells are presented as cell-A. (a) An example of 2D RF maps. The solid and dashed contours represent bright- and dark-excitatory regions, respectively. The contours are drawn such that they divide the response amplitude between 0 and either a positive or negative peak, whichever is greater, into seven equally spaced levels. Both cell-A and -B show different RF profiles in the two eyes, indicating RF phase disparities. Phase disparities for cell-A and -B are 0.47° and 0.36° in visual angle, respectively. Position disparity -X and -Y are −0.10° and −0.05° in visual angle, respectively. (b) Another example of 2D RF maps. Phase disparities for cell-A and -B are −0.28° and −0.82°, respectively. Position disparity -X and -Y are 0.32° and 0.05°, respectively. (c) An example of 1D RF profiles. The amplitude of each profile is normalized to its peak. Both cell-A and -B show relatively similar RF profiles in the two eyes. Phase disparities for cell-A and -B are −0.12 and −0.38°, respectively. Position disparity-X is −0.32°.

