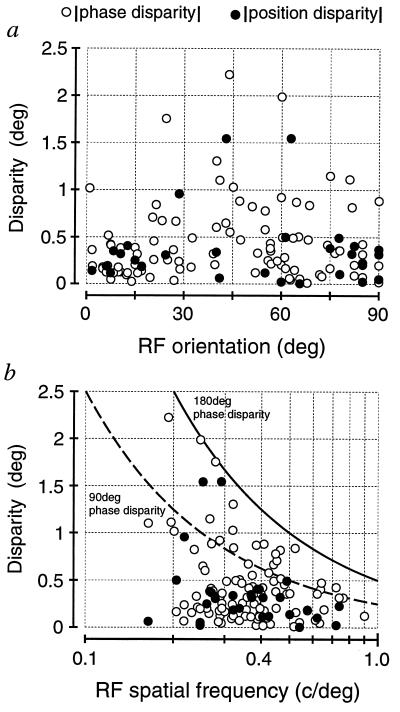
Figure 7.
Scatter plots of RF phase (○) and position (•) disparities as a function of RF orientation and spatial frequency. (a) Magnitudes of phase and position disparities are plotted as a function of RF orientation. Although there are a few outliers, most of position disparities are below 0.5°, and there seems to be no apparent differences between position disparities of cells tuned to horizontal orientations (≈0°) and those of cells tuned to vertical orientations (≈90°). On the other hand, phase disparities of cells tuned to horizontal orientations tend to be limited to about 0.5°, whereas those of cells tuned to oblique and vertical orientations are more widely spread. (b) Magnitudes of phase and position disparities are plotted as a function of RF spatial frequency. The solid and dashed lines indicate disparities equivalent to 180° and 90° phase angles, respectively. Phase disparities are scattered below the solid line, indicating that they can be used to encode a wide range of binocular disparity. On the other hand, most position disparities fall below 0.5° and are relatively constant across spatial frequency. Since phase disparities of cells tuned to high spatial frequencies are necessarily small, position disparity may play an important role in encoding binocular disparity for these cells.

