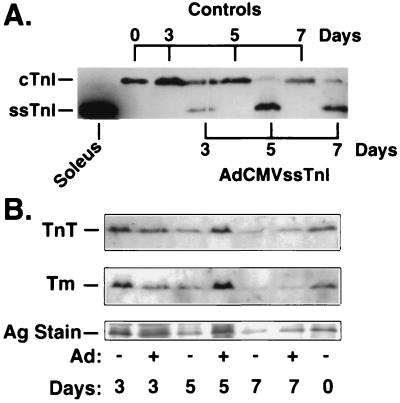
Figure 2.
Western blot analysis of regulatory protein isoforms in control and AdCMVssTnI-treated adult cardiac myocytes. (A) TnI isoform composition. Labels on top indicate days in primary culture for control myocytes while labels on bottom indicate days in culture for AdCMVssTnI-infected myocytes. A soleus slow skeletal fiber is shown as a positive control for detection of ssTnI. (B) TnT and Tm isoform composition. The day in culture (days) and experimental group (control = −; AdCMVssTnI = +) are labeled. These results (TnI, TnT, and Tm) are obtained from membrane-intact samples but also represent the pattern observed in permeabilized preparations (results not shown). A silver (Ag)-stained portion of the gel was used to normalize data for variations in protein loaded per lane. The cTnI+ssTnI/Ag stain ratio in AdCMVssTnI-treated myocytes over 7 days (0.94 ± 0.25, n = 4) is not significantly different (P > 0.05) from control myocyte values (1.56 ± 0.28, n = 4). The TnT/Ag stain and Tm/Ag stain ratios in AdCMVssTnI-infected myocytes over 7 days also are unchanged from controls (TnT/Ag stain: control = 1.27 ± 0.11, AdCMVssTnI = 1.08 ± 0.07, n = 4; Tm/Ag stain: control = 0.54 ± 0.09, AdCMVssTnI = 0.55 ± 0.17; n = 4).

