Figure 5.
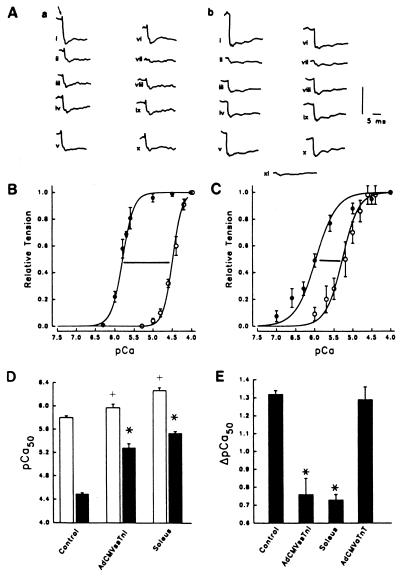
Enhanced tension generation in AdCMVssTnI-treated single, adult cardiac myocytes in culture. (A) Original fast time-base recordings of Ca2+-activated isometric tension development in a control (a) and an AdCMVssTnI-treated (b) single cardiac myocyte. In a, the pCa of the activating solution are 4.0, 6.0, 5.8, 5.3, 4.5, 4.0, 5.0, 4.6, 4.4, and 4.0, respectively. (B) pCas are 4.0, 7.0, 6.6, 6.3, 6.0, 4.0, 5.7, 5.2, 4.8, and 4.0, respectively. Records i-v in a and b were obtained at pH 7.00, and records vi-x are obtained at pH 6.20. Active tension was obtained by subtracting resting tension in relaxing solution 9.0 (b, xi) from total tension (see arrow in a, i) at each pCa. On average, tension was determined at eight different pCas at pH 7.00 and 6.20. Maximum Ca2+-activated tension is 29 kN/m2 in control and 30 kN/m2 in the AdCMVssTnI-treated myocytes shown. Vertical calibration bar is 27 kN/m2 for a and 19.7 kN/m2 for b. A summary of the tension-pCa relationships are shown for control (B) and AdCMVssTnI-treated (C) myocytes at pH 7.0 (•) and pH 6.20 (○). Active tension (P) at each submaximal pCa is expressed as a fraction of the maximum active, isometric tension at pCa 4.0 (Po) in each myocyte. The shape and position of the tension–pCa relationship in controls cultured for 6 days are unchanged from values obtained from acutely isolated myocytes. Thus, control data shown in B are pooled from control myocytes cultured for 0–6 days (n = 11–12 observations/point). Results for AdCMVssTnI-treated single cardiac myocytes are from 6-day primary cultures (n = 11–14 observations per point). (D) Summary of pCa50 in control and AdCMVssTnI-treated cardiac myocytes and in single soleus skeletal muscle fibers at pH 7.00 (empty bars) and pH 6.20 (filled bars). (E) Summary of ΔpCa50 (pCa50 pH 7.00 − pCa50 at pH 6.20) in control (n = 12) and AdCMVssTnI-treated (n = 11), and AdCMVaTnT-treated (n = 4; day 6) cardiac myocytes and in single soleus skeletal muscle fibers (n = 5). Values in B-E are expressed as mean ± SEM. The pCa50 and nH (see Results) values are derived from the tension-pCa curves as described in Methods, and n indicates the number of observations per point for the tension-pCa relationship in B and C. Cross indicates significantly different from control at pH 7.00 (D; P < 0.01). Asterisk indicates significantly different (P < 0.001) from control (E) or different from control at pH 6.20 (D).

