Fig. 5.
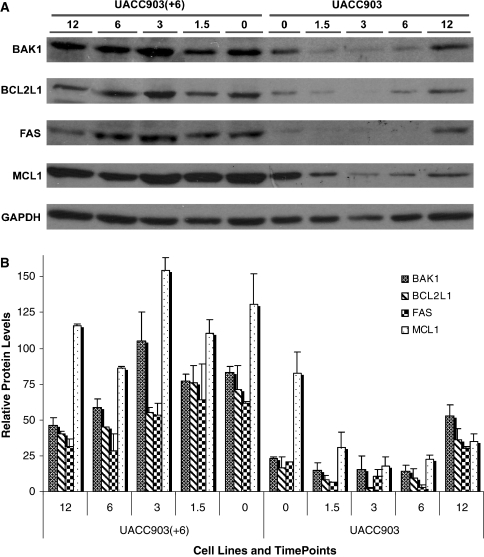
Western blots and quantification. (a) Western blot of cell lysate from UACC903(+6) and UACC903 cell lines before (0) and at 1.5-, 3-, 6-, and 12-h after the UV treatment, using the antibodies against BAK1, BCL2L1, FAS, MCL1 and GAPDH proteins. GAPDH was used as a control for loading error. (b) Bar graph for the quantitative comparison among protein expression levels. The signal intensities of a protein band and its surrounding background were scanned from images derived from two independent Western experiments for each protein and quantified by using Scanalytics IPLAB 3.6 (Rockville, MD). The resultant background-subtracted values of protein expression were normalized to those of GAPDH and then plotted as the relative protein levels for each protein at each time point in each cell line with or without UV treatment

