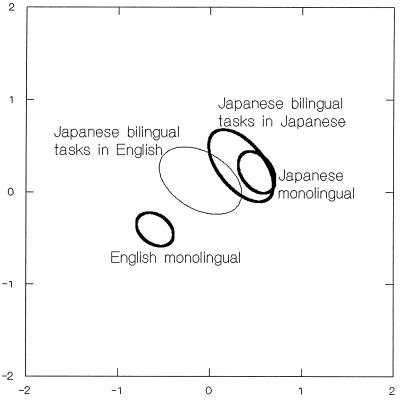
Figure 4.
A comparison of shape similarity between monolingual groups (summary of data in Fig. 3) and the bilingual Japanese performing in Japanese and English (across both tasks). Ellipses are 97.5% confidence regions of the mean; the thin ellipse is not a legitimate comparison group (see text).

