
Figure 2.
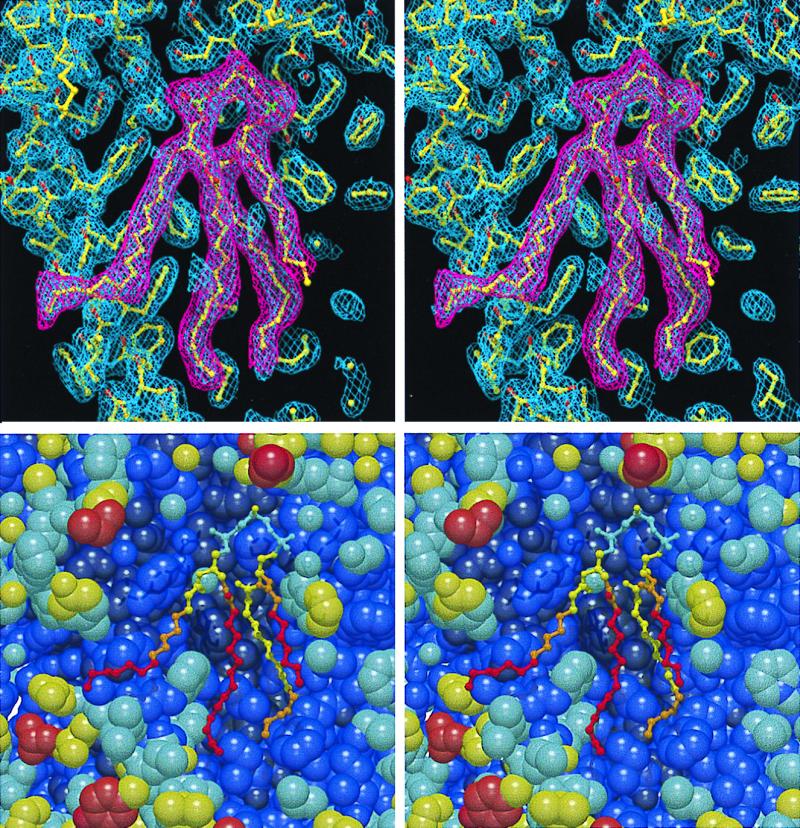
Stereo views of the model of cardiolipin at the surface of the AM260W reaction center. (A) refmac 2 mFo–DFc map (blue) of the electron density attributed to cardiolipin and that of the background protein, with the fitted structure of the protein and the cardiolipin. Overlaid is a mFo–DFc map (magenta) of the density attributed to the cardiolipin. Only those parts of the acyl chains resolved in the electron density were modeled (see text). (B) Stick model of cardiolipin and space-fill model of the surrounding protein, colored according to crystallographic temperature factor. Dark blue (0–30); blue (30–40); sky blue (40–50); yellow (50–60); orange (60–70); red (70–100).