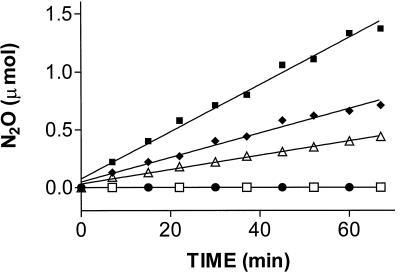
Figure 3.
N2O formation by the ba3 oxidase. The rate of N2O formation, identified by head-space analysis and gas chromatography, is shown at different enzyme concentrations in acetate buffer (pH 4.8) and ascorbate-reduced PMS. The low pH is necessary to suppress nonenzymatic N2O formation, which increases with pH and may become significant unless specific countermeasures are being taken (25). The graph combines data of duplicate experiments, which were fitted by linear regression at 4.94 (■), 2.47 (⧫), and 1.24 (▵) μM ba3, respectively; ●, enzyme boiled in 1% SDS for 5 min; □, assay mixture without the enzyme.

