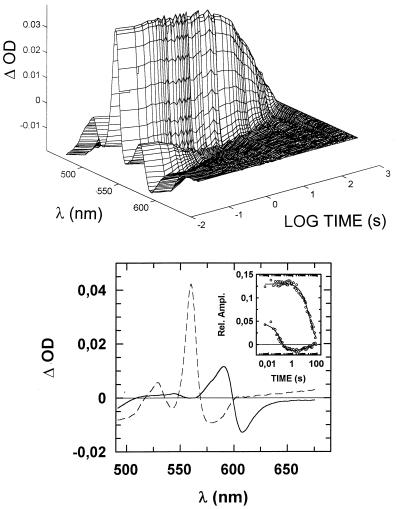
Figure 4.
Time course of the oxidation of reduced ba3 by NO. ba3 (5 μM) was reduced anaerobically by 1 mM ascorbate in the presence of 1 mM CO, and the resulting CO-bound fully reduced enzyme was mixed with 250 μM NO at 20°C. (Upper) Absorption changes collected from 10 ms to 80 s after mixing. (Lower) Optical components deconvoluted by fitting the first two V columns of the singular value decomposition output (scaled by their relative singular values) to two exponential decays (Inset: best fit). The faster phase (solid spectrum) corresponds to CO displacement by NO, proceeding at k1 = 9 s−1, whereas cytochrome b oxidation (dashed spectrum) occurs at a much slower rate, k2 = 0.04 s−1, which is consistent with the turnover number measured for NO consumption by ba3.

