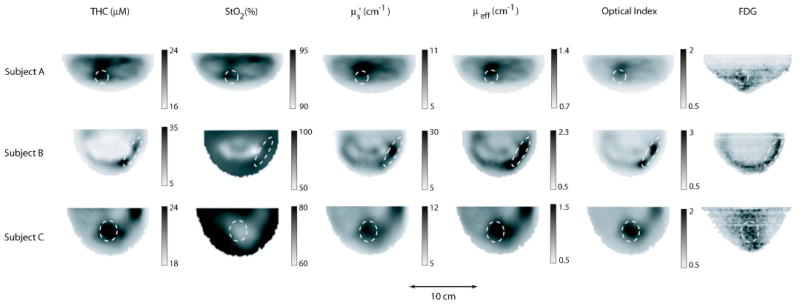
Fig. 2.

Images of the breasts from three females imaged with both DOT and BPET. Each image corresponds to a caudal-cranial slice taken from the 3D reconstruction of a breast after co-registration. Each row corresponds to a breast from one of the three patients. The columns correspond to total hemoglobin concentration (THC), tissue blood oxygenation (StO2), reduced scattering coefficient at 786 nm, overall attenuation (μeff), optical index, and FDG uptake measured with PET. The dashed ellipses enclose the regions of interest.
