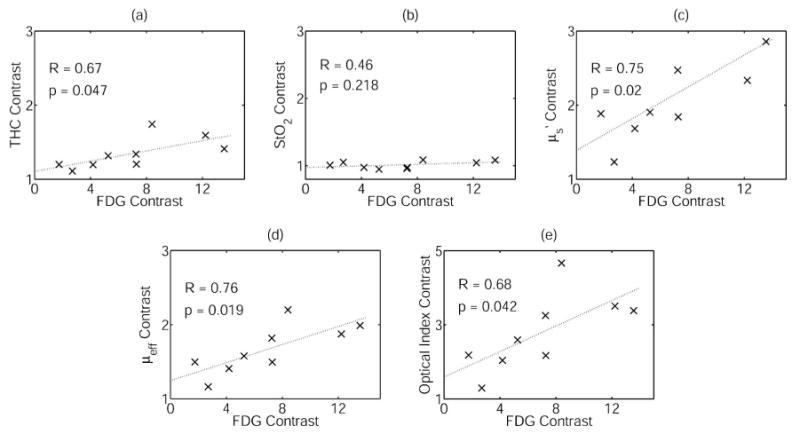
Fig. 4.

Correlations between contrast ratios in FDG uptake and DOT parameters for the nine patients with tumors visible to both DOT and PET. R and p denote the correlation coefficient and p value, respectively. (a) Total hemoglobin concentration (THC), (b) tissue blood oxygenation (StO2), (c) scattering , (d) overall attenuation μeff, (e) optical index.
