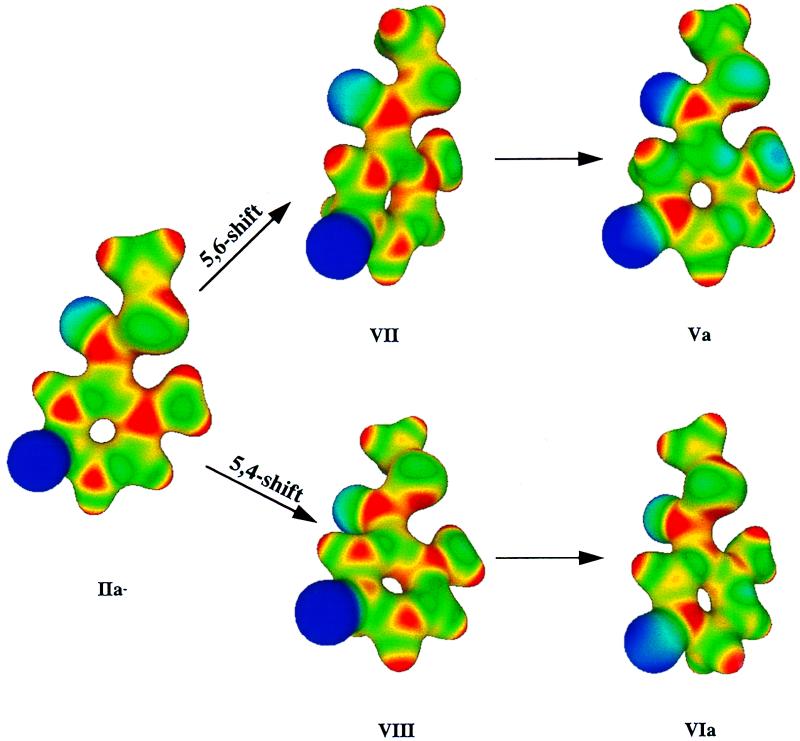
Figure 4.
Structures of the reactant (IIa−), transition states (VII and VIII), and products for the 5,6- (Va) and 5,4-shift (VIa) reactions, respectively, with electrostatic potentials projected onto the molecular surfaces of each. The electrostatic potential spectrum is from −0.05 (blue) to 0.35 (red) with and electron density of 0.002 e/bohr3, with blue representing negative electrostatic potential and red representing positive electrostatic potential.

