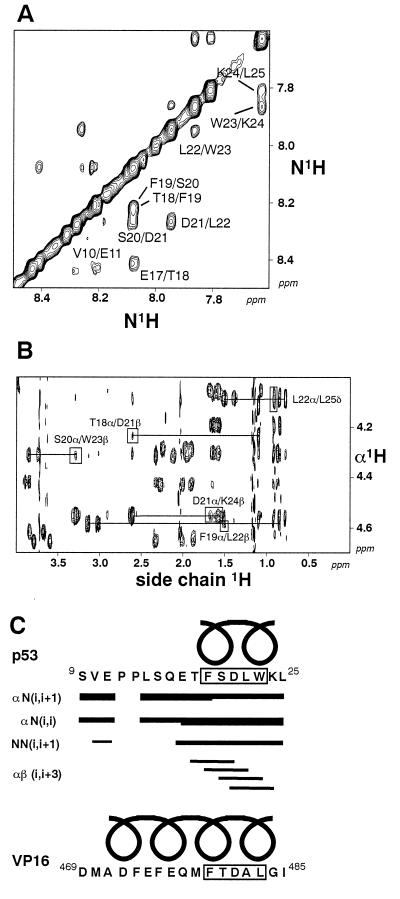
Figure 2.
Transferred NOE (TRNOE) experiments. (A) The amide region of a 200-ms NOESY spectrum of p539–25 (2.8 mM) in the presence of TAF1–140 (0.3 mM). The identities of residues that exhibit NOE cross-peaks in this region are indicated. (B) The αβ region of a 350-ms NOESY spectrum of p5310–25 (3.5 mM) in the presence of TAF1–140 (0.3 mM). The identities of key NOEs are indicated. (C) Summary of the NOEs observed from the TRNOE experiments of p539–25 and p5310–25 and comparison between p539–25 and VP16469–485. The thickness of the lines indicates the relative intensities of the NOE cross-peaks. Black coils above the sequences represent the regions over which α-helix induction is observed upon binding to TAF1–140. The data of VP16469–485 are from ref. 18.

