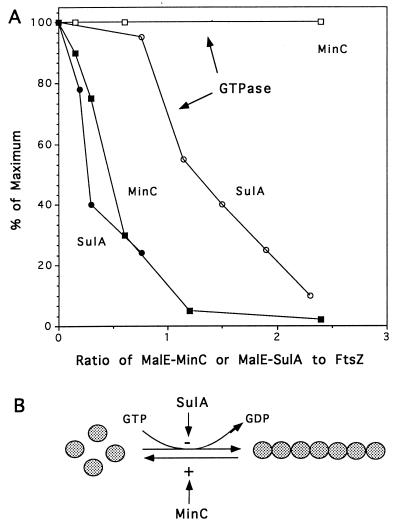
Figure 6.
Comparison of the effects of MinC and SulA on FtsZ. (A) The data obtained previously for SulA's effect on FtsZ (45) are plotted along with the results of MinC obtained in this study. The GTPase activity and amount of polymer obtained in the absence of inhibitor was set at 100%. The fractional values obtained in the presence of the inhibitors are plotted versus the molar ratio of inhibitor to FtsZ. For the purposes of comparison we have assumed the inhibitor is a monomer. The open symbols are GTPase activity, and the filled symbols are for polymerization. (B) This diagram contrasts the different steps affected by the two inhibitors. SulA blocks the GTPase activity and polymerization. In contrast, MinC prevents net assembly of FtsZ without inhibiting the GTPase activity, arguing that it promotes disassembly.

