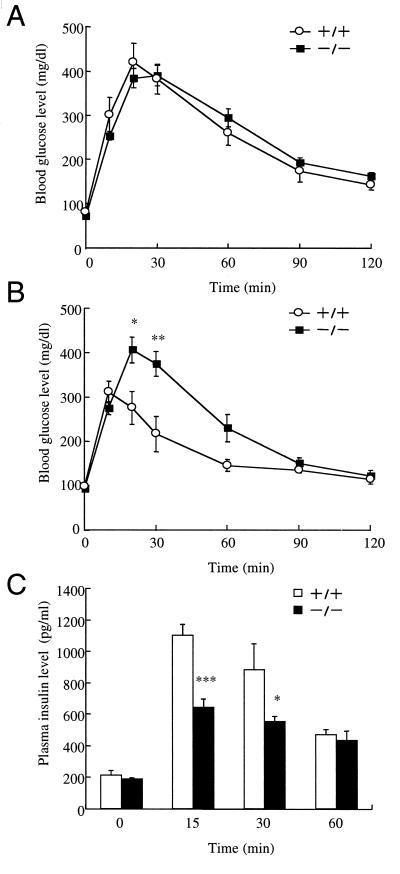
Figure 3.
Glucose tolerance test. (A) Intraperitoneal glucose tolerance test in age-matched GIPR+/+ mice (○, n = 4) and GIPR−/− (■, n = 6). (B) Oral glucose tolerance test in age-matched GIPR+/+ mice (○, n = 4) and GIPR−/− (■, n = 6). (C) Plasma insulin levels after oral glucose loading for age-matched GIPR+/+ mice (open bars, n = 4) and GIPR−/− (filled bars, n = 6). Statistical significance was assessed by using the unpaired t test. Values are indicated as mean ± SE. *, P < 0.05; **, P < 0.01; ***, P < 0.001 for GIPR−/− mice vs. GIPR+/+.

