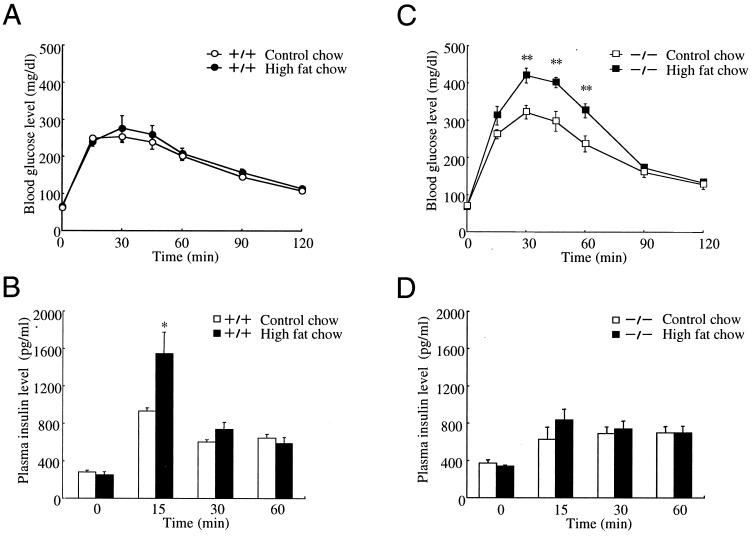
Figure 4.
Effects of diet on blood glucose levels and plasma insulin levels after meal ingestion. GIPR+/+ mice (A and B) and GIPR−/− mice (C and D) were fed control diet (open symbols) or high fat diet (closed symbols). Blood glucose levels (A and C) and plasma insulin levels (B and D) were measured after meal ingestion. Values are indicated as mean ± SE. *, P < 0.05; **, P < 0.01.

