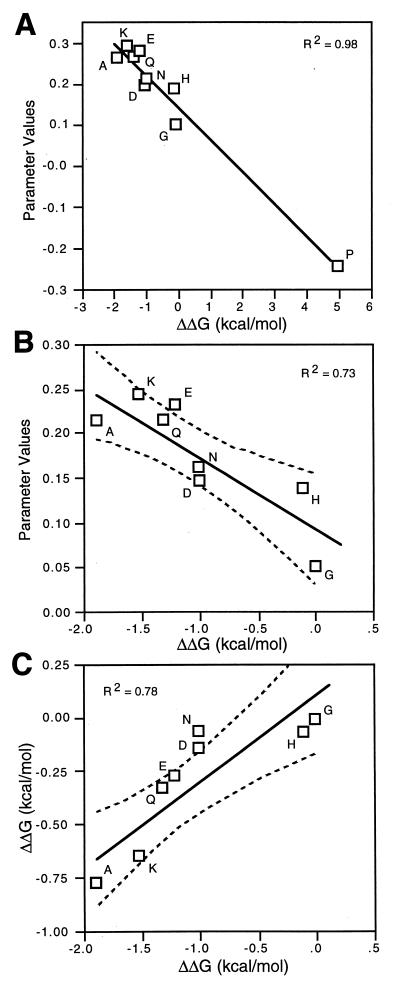
Figure 3.
Correlation between intrinsic helix propensity values for amino acids determined by biophysical methods and by regression analysis of a patterned library. A compares the regression analysis parameters of all nine amino acids that were variant in our library with α-helical propensity values derived from biophysical measurements (guest-host experiments in alanine peptides) on peptides in aqueous solution (40). B compares regression parameter values of the variant amino acids minus proline with α-helical propensity values derived from biophysical measurements (40). C compares α-helical propensity values derived from biophysical measurements from the laboratories of Baldwin (40) and DeGrado (35). The solid lines have been fit by least squares, and the dotted curves represent the 95% confidence limits of the fit.

