Figure 1.
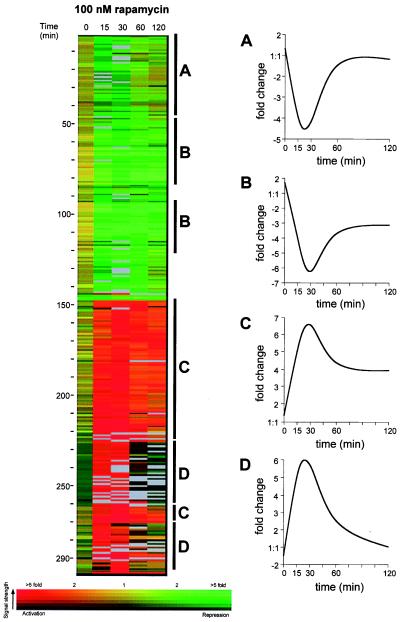
The 297 genes whose mRNA transcript levels changed more than four-fold after rapamycin exposure were clustered according to their expression profile over time by the genespring software package. The expression profile of each regulated gene is displayed as a row. Fold changes in expression are indicated by color value according to the color bar at the bottom of the figure (red, increased expression; yellow, no change in expression; green, decrease in expression). Fluorescence signal strength from the microarray is indicated by color brightness (saturated color, high fluorescence; black, low fluorescence). Gray bars indicate missing data points. Genes regulated similarly are labeled, and their general expression patterns over time are displayed (A–D).

