
Fig. 1.
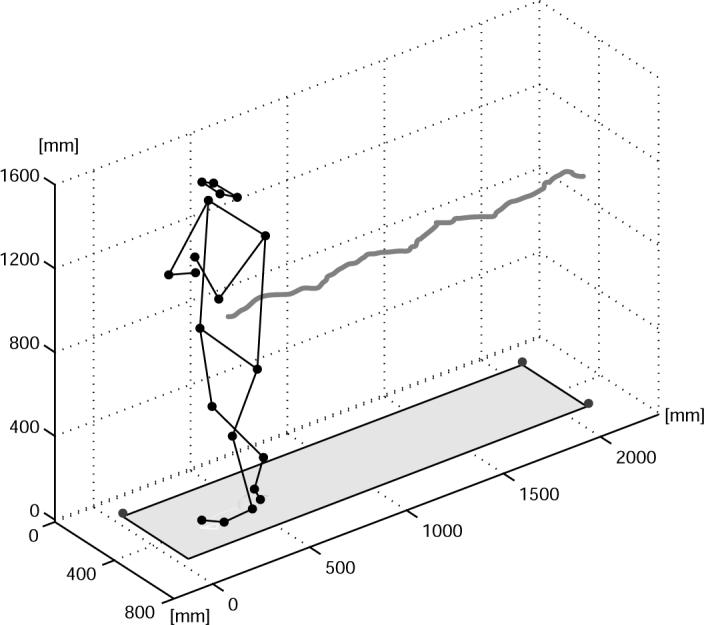
3D reconstruction of the experimental set-up. Markers from Motion Analysis are represented as black spheres. Trace of the center-of-mass, calculated from the Motion Analysis data and the subject's anthropometric measures, is also represented.