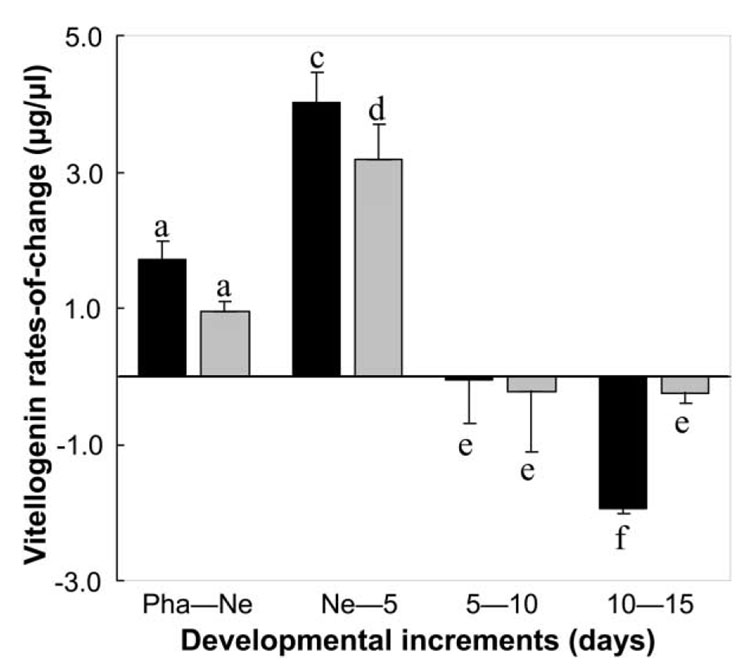
Figure 2.
Vitellogenin rates of change in selected pollen-hoarding strains measured from onset of synthesis in pharate adults (Pha) and until workers were 15 days old. For each successive life stage, the plot quantifies how much the vitllogenin level changes relative to the prior stage. An increase, therefore, is shown as a positive rate of change, a decline as a negative rate of change, and a constant titer as no (0) rate of change. Mean rates of change were calculated from individual hemolymph titers (n = 16–20 for each age and strain) obtained from three replicate colony setups. Error bars indicate standard errors; lowercase letters indicate significant difference between high and low strains (Mann-Whitney U-test: P < .05).

