Fig. 1.

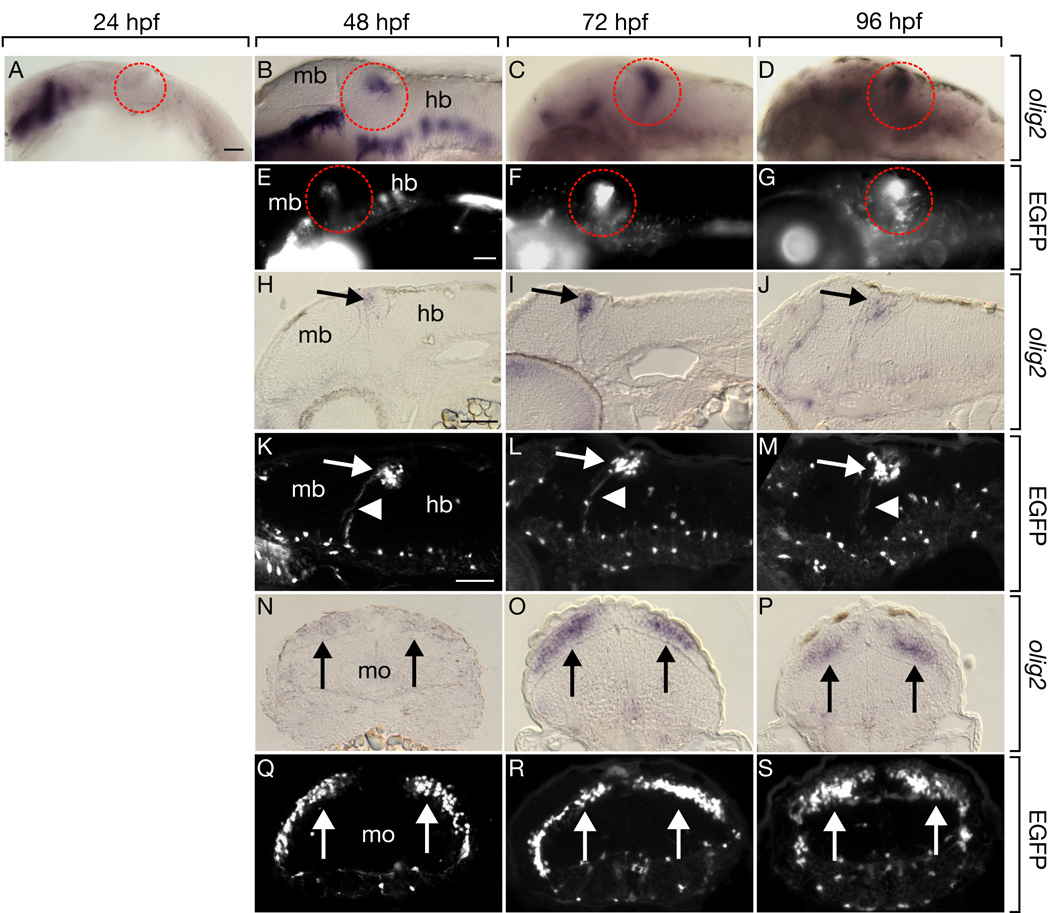
Transgenic reporter gene expression recapitulates endogenous olig2 RNA expression in zebrafish cerebellum. Lateral whole mount views and sagital sections are shown with dorsal up and anterior to the left. Transverse sections are oriented dorsal up. Midbrain (mb), hindbrain (hb) and medulla oblongata (mo) are marked. (A–D) Developmental time course of olig2 expression detected by in situ RNA hybridization in whole embryos. Dashed circles mark where cerebellum is located. (E–G) EGFP expression driven by the Tg(olig2:egfp) transgene in live embryos. Expression within cerebellum is circled. (H–J) Sagital sections through cerebellum with olig2 RNA expression marked by arrows. (K–M) Arrows mark EGFP+ cells in cerebellum of sagitally sectioned Tg(olig2:egfp) embryos and arrowheads show axonal extensions from EGFP+ cells. Transverse sections through cerebellum showing olig2 RNA (N–P) and EGFP (Q–S) expression marked by arrows. Scale bars represent 20 µm in all panels.
