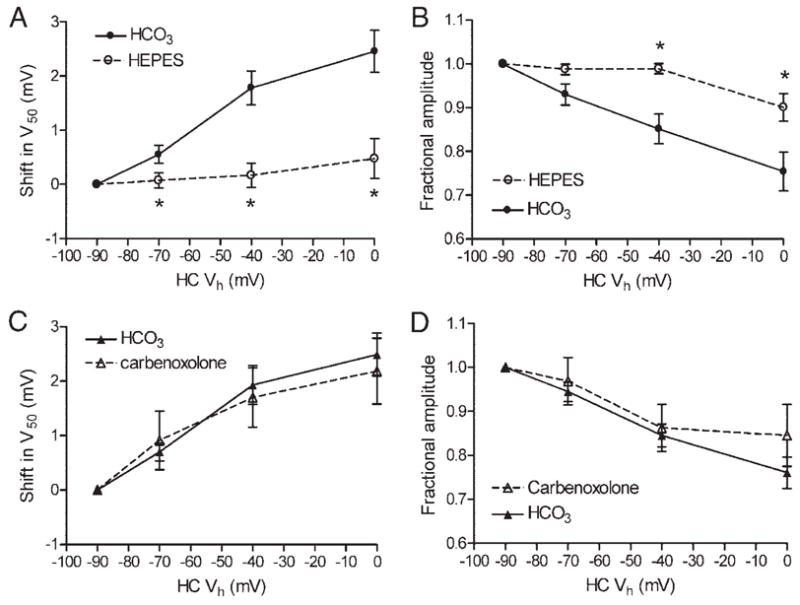
FIG. 2.

Changes in the activation midpoint (A and C) and peak amplitude (B and D) of cone ICa produced by progressive depolarization in simultaneously recorded HCs. Shift in (A and C) is V50 plotted relative to that obtained when the HC was held at −90 mV. Change in amplitude (B and D) is plotted as a fraction of amplitude measured when the HC was held at −90 mV. Application of HEPES (10 mM) significantly reduced changes in both V50 (A) and amplitude (B, ○) relative to paired control measurements (n = 14; 2– 4 measurements/cell) made before HEPES application in the same cones (●). Carbenoxolone (0.2 mM; ▵) did not significantly alter the shift (C) or amplitude (D) changes produced by HC polarization relative to paired controls (n = 7, ▴). *P < 0.05, paired t-test. pH of all solutions was 7.4.
