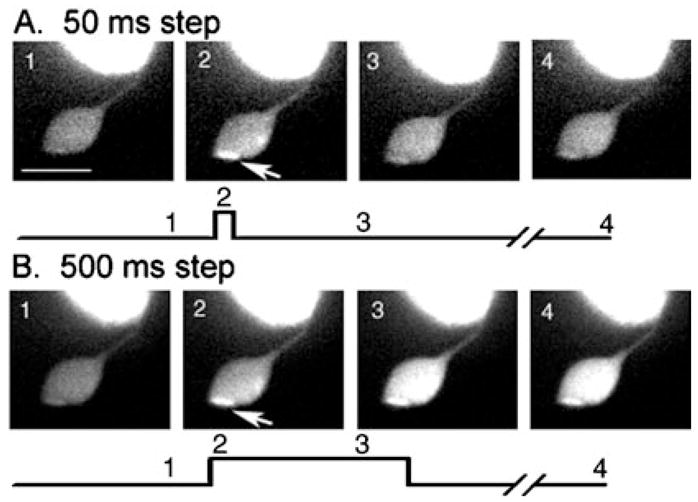
Fig. 2.

Changes in [Ca2+]i in the synaptic terminal of a voltage-clamped rod in the retinal slice evoked by depolarizing steps (−70 to −10 mV). Calcium changes were visualized by including a high-affinity calcium-sensitive dye, Oregon Green 488 BAPTA-1 (100 μM; Kd = 0.17 μM), in the patch pipette solution. This single confocal section was cropped to show the terminal, axon and base of the cell body. The top row (A) shows responses to a step of 50 ms; the bottom row (B) shows responses to a step of 500 ms. Image timing is shown diagramatically below each set of images. Image 1 is a control image obtained prior to the step. Image 2 shows the image obtained at the beginning of the test step. For the 50-ms step (A), image 3 was obtained 250 ms after the end of the 50-ms test step whereas for the 500-ms step (B), image 3 was obtained 300 ms into the test step. Image 4 in A and B were both obtained 2.5 s after the beginning of the test step. Arrows point to a local hot spot of Ca2+ increase. Image acquisition time: 55 ms. Scale bar, 10 μm.
