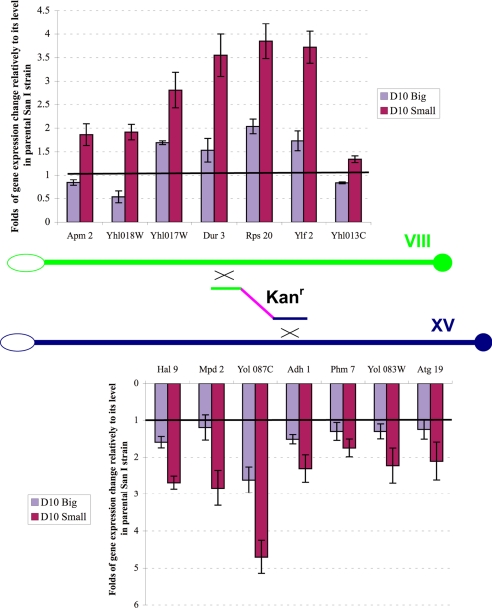
Fig. 3.
Graphic representation of the quantitative RT-PCR gene expression patterns from Fig. S3 of the various genes on both sides of the translocations breakpoints on chromosome VIII (Upper) and XV (Lower) compared with the level of the reporter gene HSC82 in the wild-type strain taken as 1 (horizontal black line).

