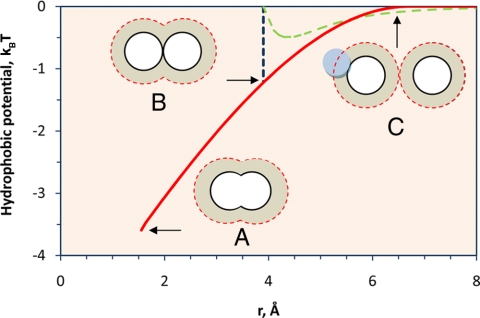
Fig. 4.
The hydrophobic potential between two methane molecules in water at 25°C estimated from the change in the hydration volume. The methane molecules are separated by the C–C bond length (r = 1.533 Å) (A), are at contact (B), and have nonoverlapping solvation shells (C). For comparison, the dashed line shows the Lennard–Jones potential between two isolated methane molecules. The dotted lines show the outer boundary of the solvation shell. The perpendicular dash-dotted line shows position (B) when the methane molecules are at contact.

