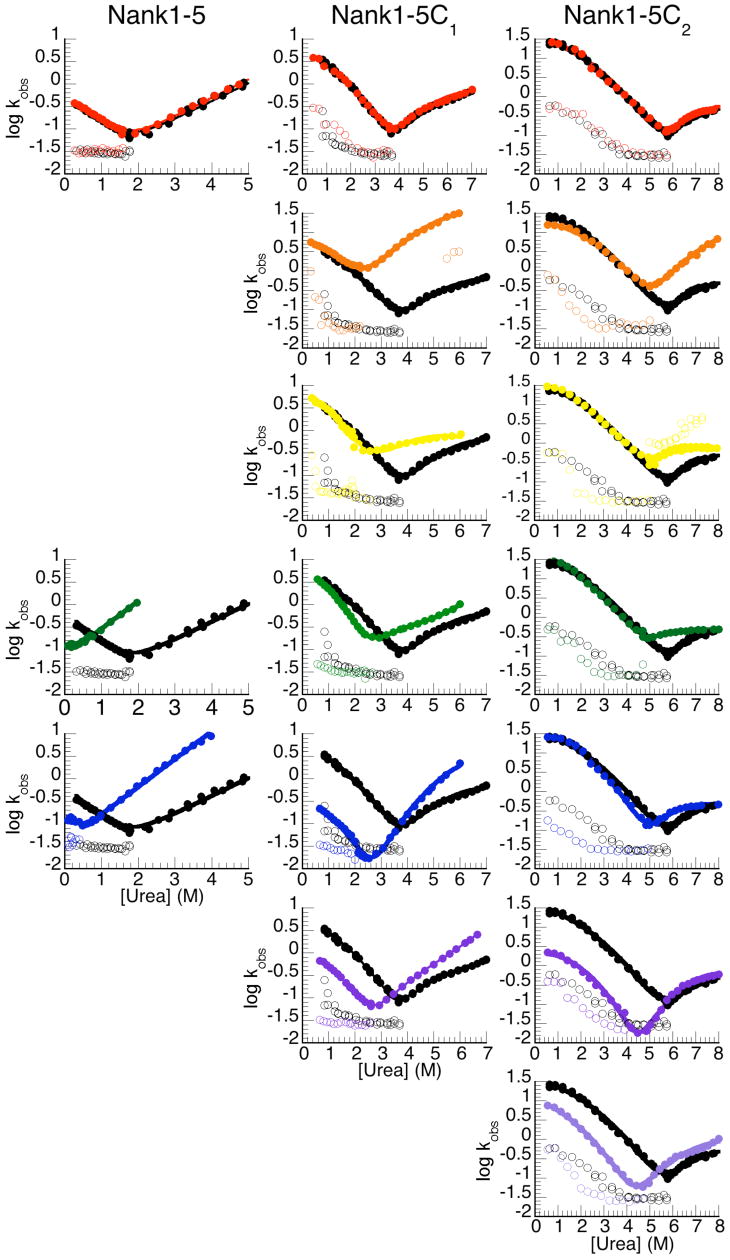
Figure 3.

Effects of conserved alanine to glycine substitutions on folding kinetics. Chevron plots (log kobs vs. urea concentraion), monitored by tryptophan fluorescence, alanine to glycine variants. Rate constants of constructs that contain alanine to glycine substitutions in Nank1-5 (left column), Nank1-5C1 (center column), and Nank1-5C2 (right column). Filled circles represent rate constants for the major refolding and unfolding phases, open circles represent rate constants for the minor refolding and unfolding phases. Each panel shows a single alanine to glycine substitution (colored as in Figure 2), compared to the parent construct (black), starting in the first repeat (top) and progressing toward the consensus repeats (bottom, see numbering at right).
