
Figure 4.
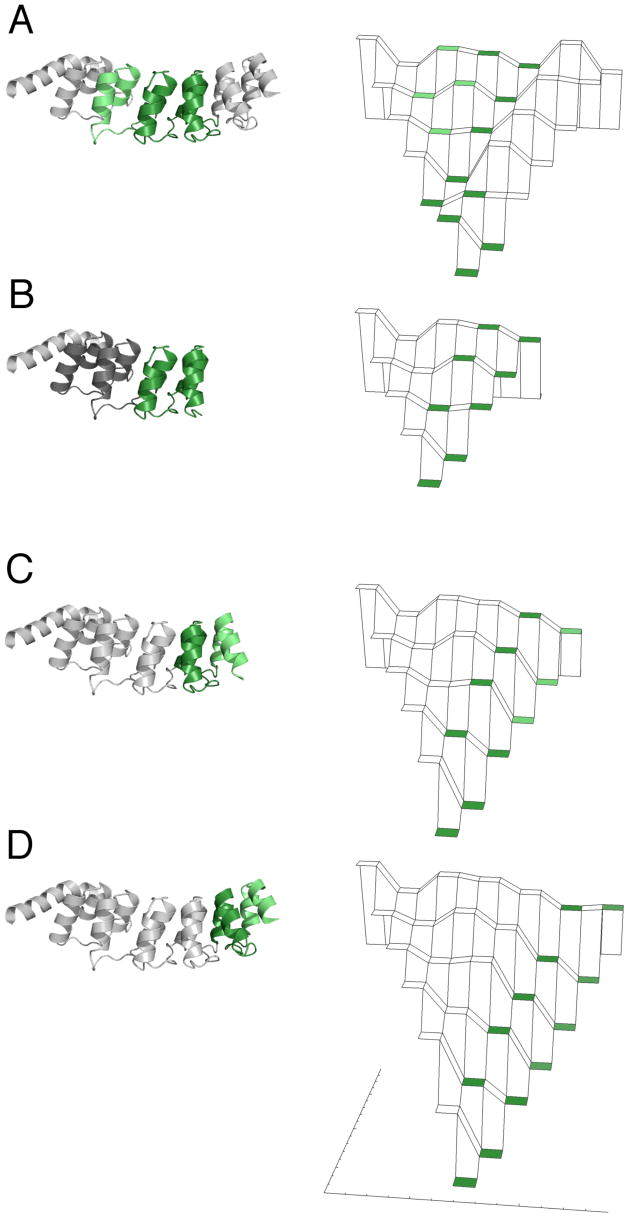
The distribution of structure in the transition state ensembles of C-terminally stabilized ankyrin repeat constructs, and the shift in the energy landscape from adding consensus repeats. Left: the transition state ensemble of the full length Notch ankyrin domain (A) is compared with that of Nank1-5 (B), Nank1-5C1 (C), and Nank1-5C2 (D). Repeats with high Φ-values are shaded green; those with zero Φ-values are shaded white. Constructs for which Φ-values could not be determined, Nank1-5 (AG2) and Nank1-5 (AG3), are colored grey. All Φ-values are mapped onto the crystal structure of Nank1-7Δ. Ribbon diagrams were generated using MacPymol.45. Right: energy landscapes, showing free energy (vertical direction) as a function of the number of folded repeats (back to front for denatured to native state, respectively) and the localization of structure (left to right for N- and C-terminally localized structure, respectively). Landscape tiers are shaded corresponding to Φ-values as in the ribbon diagrams.