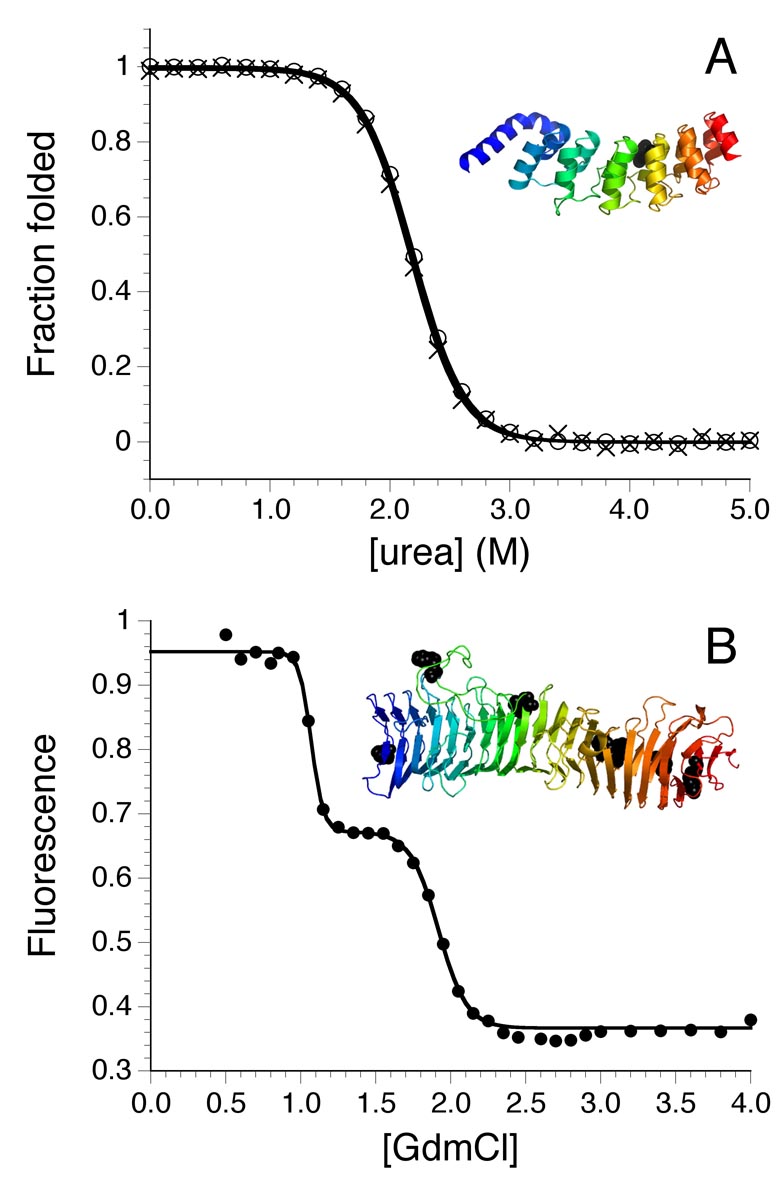
Figure 3. Equilibrium two-state and multistate unfolding of repeat proteins.
(A) Urea-induced unfolding of the Notch ankyrin domain, monitored by tryptophan fluorescence (circles) and CD (x’s) in the α-helical region. Data are converted to fraction folded to illustrate the coincidence of these two probes. The ribbon model shows the relative positions of the helices and the single tryptophan. Data adapted from [52]. (B) Guanidinium chloride-induced unfolding of pertactin, monitored by tryptophan fluorescence. The unfolding transition shows clear multistate reaction in which an intermediate is formed at ~1.5 M guanidinium chloride. Adapted with permission from [55].

