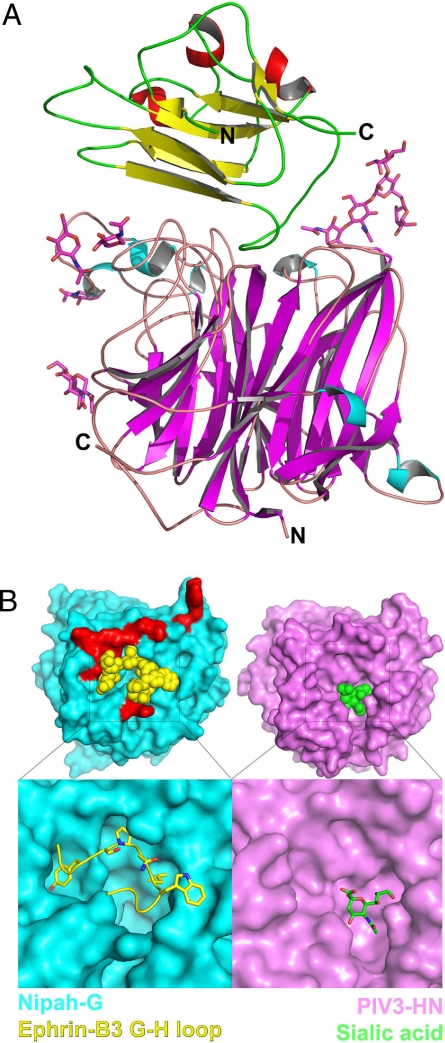
Fig. 2.
Crystal structure of the NiV-G/ephrin-B3 complex. (A) Side view of the NiV-G/ephrin-B3 complex. The β-strands of NiV-G are colored in magenta, and the α-helices are in cyan. The β-strands of ephrin-B3 are colored in yellow and the α-helices are in red. The carbohydrate moieties, shown as stick models, do not interact with ephrin-B3 but extend in the solvent. The N and C termini of the molecules are labeled. (B) The molecular surfaces of the henipavirus (cyan) and the parainfluenza virus (magenta) attachment proteins along the top (or receptor-binding) face of the molecules. The lower images are close-up views of the receptor-binding pockets with the bound receptor (ephrin-B3 G–H loop in yellow, sialic acid in green). Only the G–H loop of ephrin-B3 is shown. In red are shown the NiV-G residues that interact with ephrin-B3 residues outside of the G–H loop, highlighting the polar region of the NiV-G/ephrin interface.

