
Figure 1.
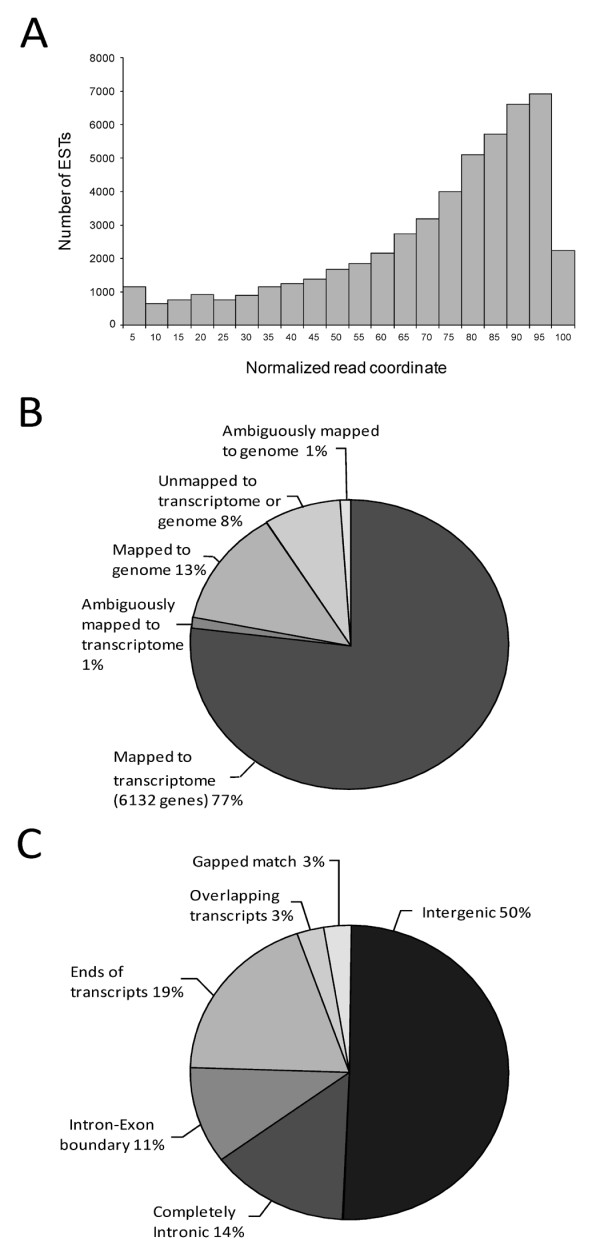
454 ESTs mapping to Caenorhabditis elegans transcripts. (A) Histogram showing the distribution of 454 expressed sequence tags (ESTs) mapping to Caenorhabditis elegans transcripts. Coordinate 0 on the x-axis represents the 5'-end of the transcripts. (B) Summary of 454 EST mapping result to the C. elegans transcriptome and genome. (C) Categorization of genomic 454 EST hits.