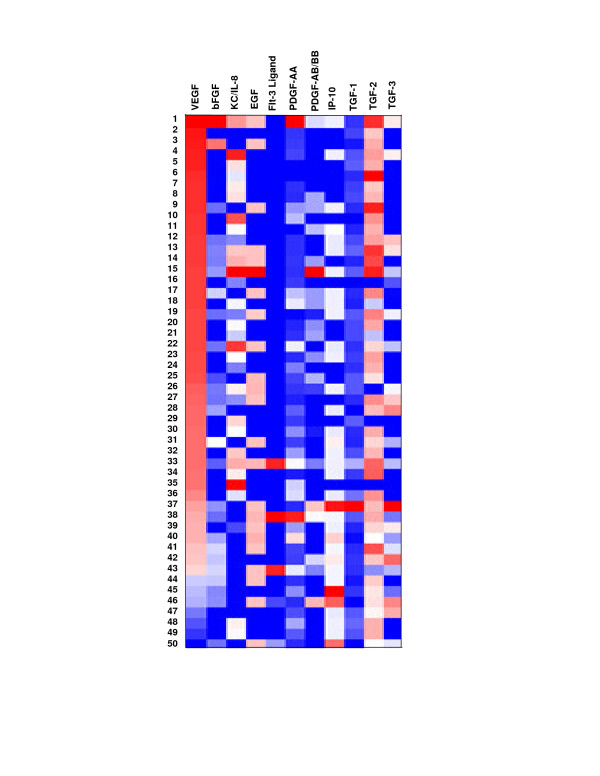
Figure 3.
Differential expression of angiogenesis-related factors is evident across samples. Differential levels of expression are evident across all patients for the angiogenesis-related factors tested. Bright red indicates lowest expression level difference, bright blue indicates highest expression level difference, and white indicates no data. Correlation coefficients indicate the differences in VEGF are not correlated to differences in expression of the other angiogenesis-related proteins.

