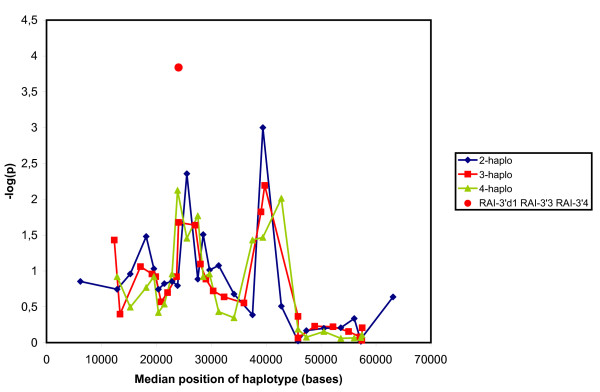
Figure 3.
Association of sets of neighbouring SNPs with breast cancer. The overall p-value for the association of a set of markers as calculated by HelixTree is depicted against the median position of the markers. The singular point represent the value for the haplotype RAI-3'd1 RAI-3'd3 RAI-3'4. (Blue), haplotypes made up of 2 neighboring polymorphisms. (Red), haplotypes made up of 3 neighboring polymorphisms. (Green), haplotypes made up of 4 neighboring polymorphisms.

