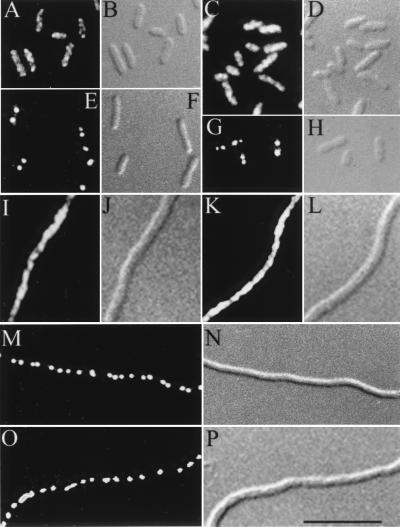
Figure 2.
ParB staining in various cells. In each pair of panels, Left is Cy3 fluorescence of antibodies against ParB, and Right is the Nomarski image of log-phase cells (A–H) and cephalexin-treated cells (I–P). (A, B, I, and J) Cells containing only ParB but no parS [N99(pBEF118)]. (C, D, K, and L) Cells containing ParA and ParB and no parS [N99(λparAB)]. (E, F, M, and N) Cells containing ParB and a copy of parS inserted in the bacterial chromosome [N99(λparS, pBEF118)]. (G, H, O, and P) Cells containing pLG48 with ParA and ParB [N99(λparAB, pLG48)]. (Bar = 5 μm.)

