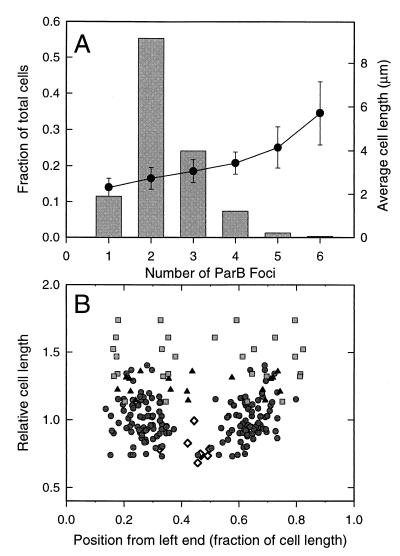
Figure 3.
Position and frequency of ParB foci in N99 (pLG44) cells. (A) Histogram showing the frequency (left axis) and average length (right axis) of cells with different numbers of discrete ParB foci (n = 625 cells). (B) The positions of ParB foci measured in cells of different length. The cells were oriented such that the left end was the end nearest a focus. Relative cell length refers to the individual cell length relative to the average size of cells that contain two foci. Foci from cells with one focus (◊), two foci (●), three foci (▴), or four foci (■) are shown.

