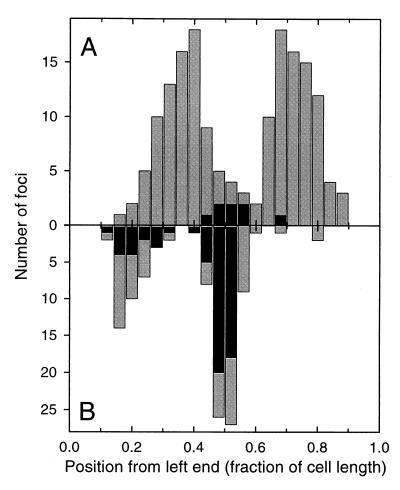
Figure 4.
Effect of ParA on the position of ParB foci. The histograms show the position of foci, as a fraction of cell length, for pLG44 (with ParA) (A) and pLG48 plus pBEF118 (no ParA) (B). For simplicity, only cells containing one or two foci were included. The cells were oriented such that the left end was nearest a focus. The position of foci from cells with one focus is indicated in black, and that from cells with two foci is indicated in gray.

