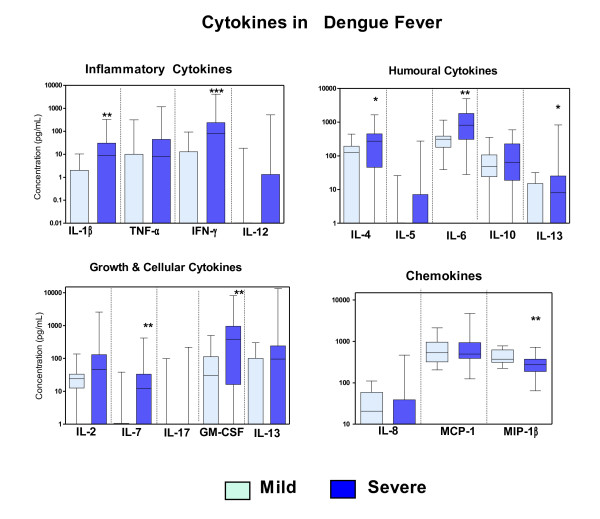
Figure 1.
Cytokine levels in plasma from patients with mild and severe dengue. Box-and-whiskers graph. The box extends from the 25th to the 75th percentile and the line at the middle is the median. The error bars, or whiskers extend down to the lowest value and up to the highest. Factors were sorted according to their functional groups. Mann-Whitney U test was used to evaluate differences between cytokine concentration from severe and mild dengue patients. * P < 0.05, ** P < 0.01 and ** P < 0.001.

