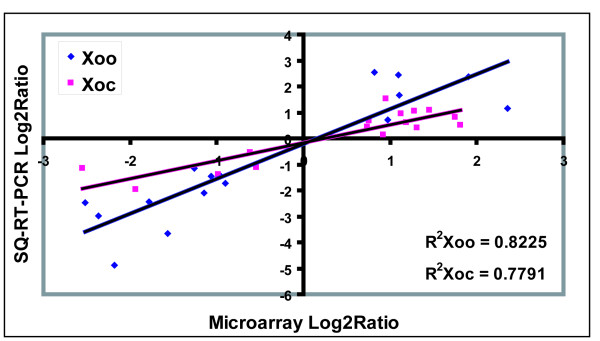
Figure 2.
Comparison of transcription measurements by microarray and semi-quantitative RT-PCR assays in Xoo and Xoc. The relative transcriptional levels for the 16 genes of Xoo and Xoc were determined by microarray and semi-quantitative RT-PCR. The semi-quantitative RT-PCR log2ratio values were plotted against the microarray data log2ratio values. The correlation coefficients (R2) between the two dataset are 0.8225 and 0.7791 for Xoo and Xoc respectively.

