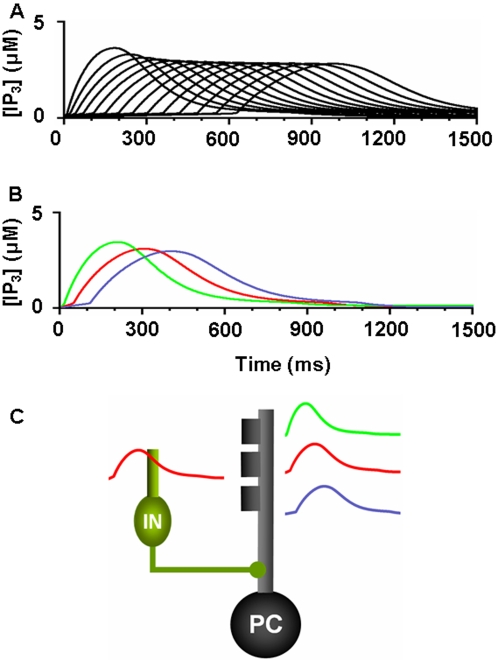
Figure 14. Distribution of IP3 activation profiles for the PC-IN population used in the model.
A. IP3 activation in PC-IN population after onset of a PF signal. Each PC-IN pair is assumed to have one main time constant that generates an IP3 profile. The curves show IP3 activations by a PF signal that continued throughout the displayed time period (1500 ms). For clarity, every fourth IP3 component used in the simulation is displayed. It is assumed that the distribution of the peak time has a broad Gaussian distribution with a center around 300 ms, thus having a relatively denser representation at early timing. B. An example of one shared IP3 peak latency (in red) and two small variations (in blue and green) inside of a PC-IN pair. C. A cartoon explanation of the IP3 latencies. In this example, the PC has an IP3 peak latency of 300 ms (red) shared with the IN dendrite. A variation of IP3 peak latencies at 200 ms (green) and 400 ms (blue) are assigned to the other two spines. Note that in this example only the 300 ms peak latency is shared by the PC and IN (red).

