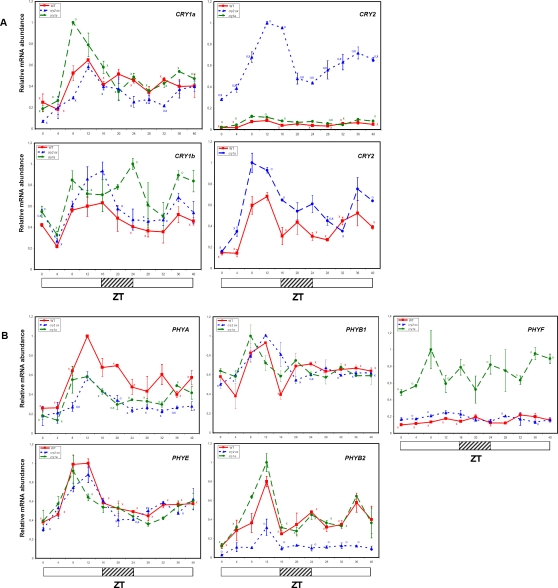
Figure 7. Effect of CRY1a loss-of function and CRY2 over-expression on circadian expression of tomato cryptochrome (A) and phytochrome (B) genes in LL.
Wt, cry1a- and CRY2-OX tomato plants were entrained under LD cycles and then transferred to LL. The abundance of the mRNAs were measured by QRT-PCR. Results are presented as a proportion of the highest value after normalization with β-actin. Open and hatched bars along the horizontal axis represent light and subjective night periods, respectively. Time points are measured in hours from dawn (zeitgeber Time [ZT]). An additional panel depicts CRY2 transcript values in wt and cry1a- genotypes to avoid the masking effect of CRY2-OX values. Data shown are the average of two biological replicates, with error bars representing SEM. Circles (O) indicate time points of CRY2-OX and cry1a- genotypes, significantly different from the corresponding ones in wt genotype (Student's t test, P ≤ 0.05). For each genotype, X indicate time points significantly different from the highest transcription value (Student's t test, P ≤ 0.05).

