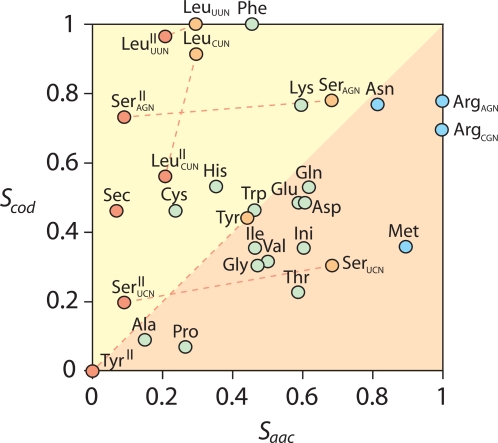
Figure 4. Plot describing the relationship between ancestries of amino acid charging (Saac) and codon identity (Scod) function, normalized to a 0–1 scale.
Dashed lines describe the effect of excluding type I tRNA variants from the constraints (from orange to red circles), and illustrate recruitment events related to the loss of the variable arm in these molecules. Color schemes of circles follow those of Figure 2.

