
FIGURE 2.
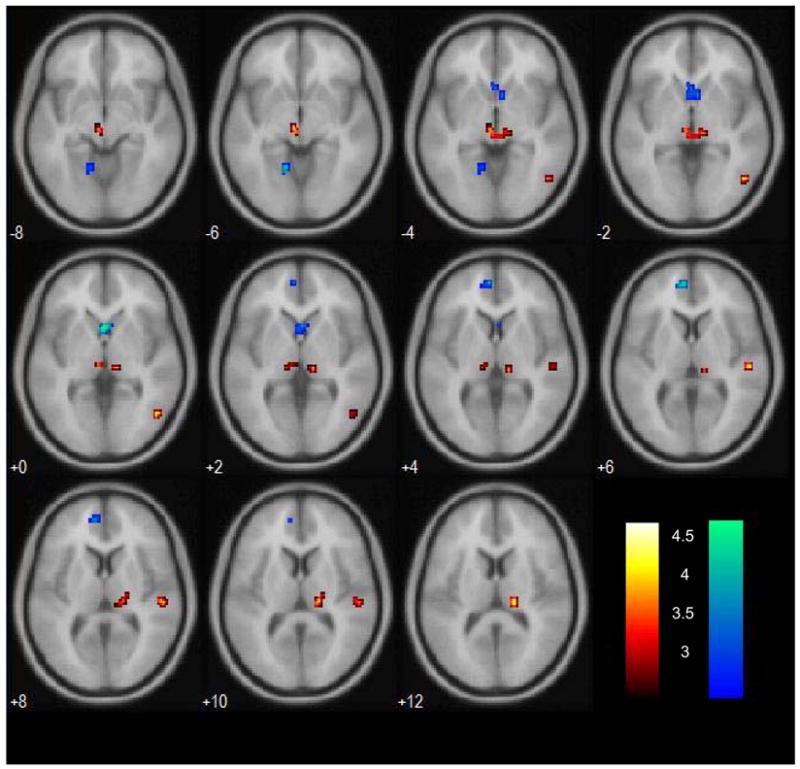
(a) Subcortical structures showing greater activation in individuals with long SSRT, as compared to those with short SSRT, for the contrast “stop success > stop error,” at p<0.005, uncorrected for multiple comparisons (warm color). BOLD signals are overlaid on axial slices (from z=−8mm to +12mm) of a smoothed structural image. (b) Activations for the reverse contrast – short > long SSRT – were shown for the same axial slices for comparison (cold color). Color bar represents voxel T value. Neurological orientation: R=R.