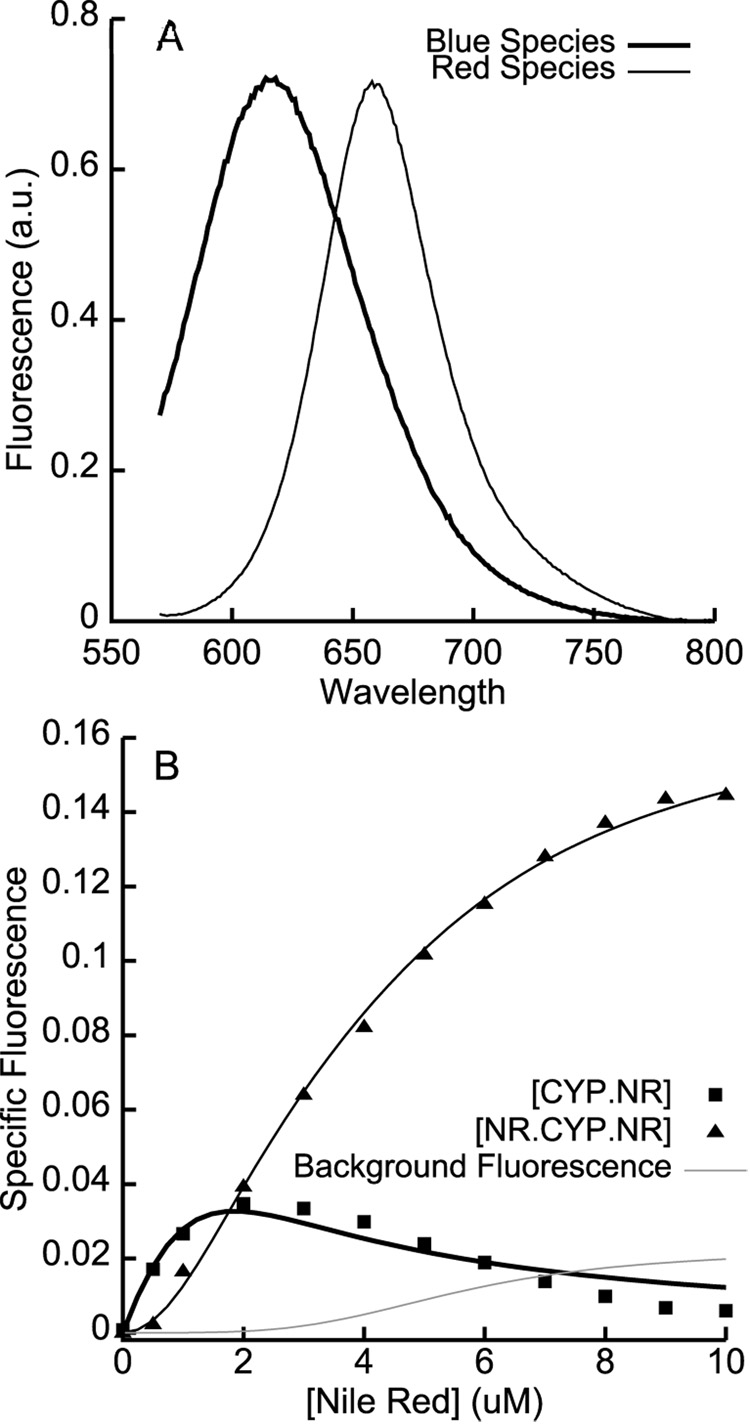
Figure 3.
A. The basis spectra used for spectral deconvolution of Nile Red fluorescence. The blue species was obtained from Nile Red bound to CYP3A4 L211F/D214E; the red species basis spectrum was obtained from the normalized difference between the blue basis spectrum and Nile Red bound to wtCYP3A4. B. The deconvoluted specific binding isotherms show the initial increase in the blue species at low [Nile Red], followed by its decline and the concomitant sigmoidal increase in the red species at higher [Nile Red]. The solid lines are global fits to kinetic simulations of a two-site sequential binding model with KD values of 0.32 ± 0.18 µM and 2.2 ± 0.33 µM. The grey line shows the free Nile Red contribution to the ‘red’ fluorescent species, based on a standard curve with Nile Red in buffer and the steady-state free Nile Red concentration obtained from the kinetic simulations.

