Figure 4.
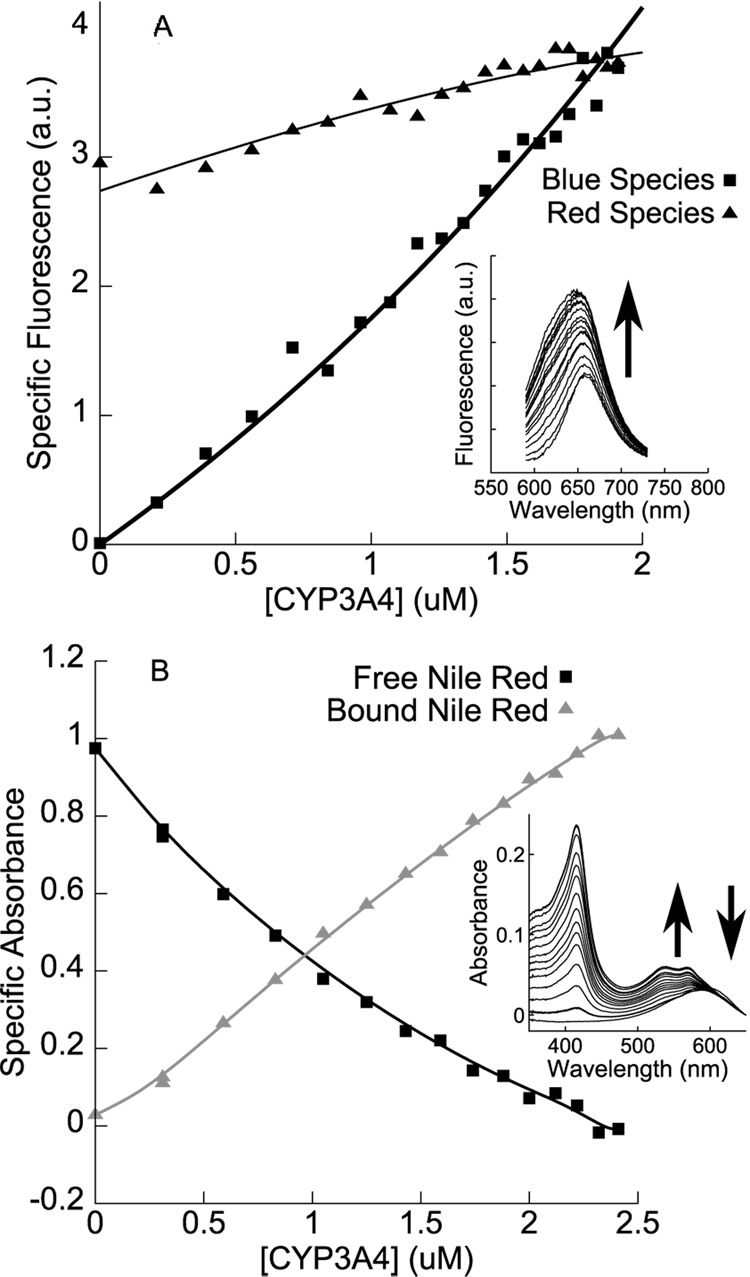
A. Fluorescence-monitored reverse titration of CYP3A4 into a fixed (10 µM) concentration of Nile Red, with an increase in the fluorescence of both red and blue species confirming the binding of multiple Nile Red molecules to a single molecule of CYP3A4. (Solid lines are guides to the eye.) B. Absorbance-monitored reverse titration under similar conditions, showing the blue-shift of Nile Red absorbance upon binding to CYP3A4. Specific absorbance isotherms were generated by spectral deconvolution, using as basis spectra CYP3A4 absorbance spectra in high-spin and low-spin states, the absorbance spectrum of 10 µM Nile Red in buffer, and the residual between the aforementioned three bases and the last spectrum of the titration (taken to represent ‘bound Nile Red’). Only isotherms for free and bound Nile Red are shown. Solid lines are guides to the eye.

