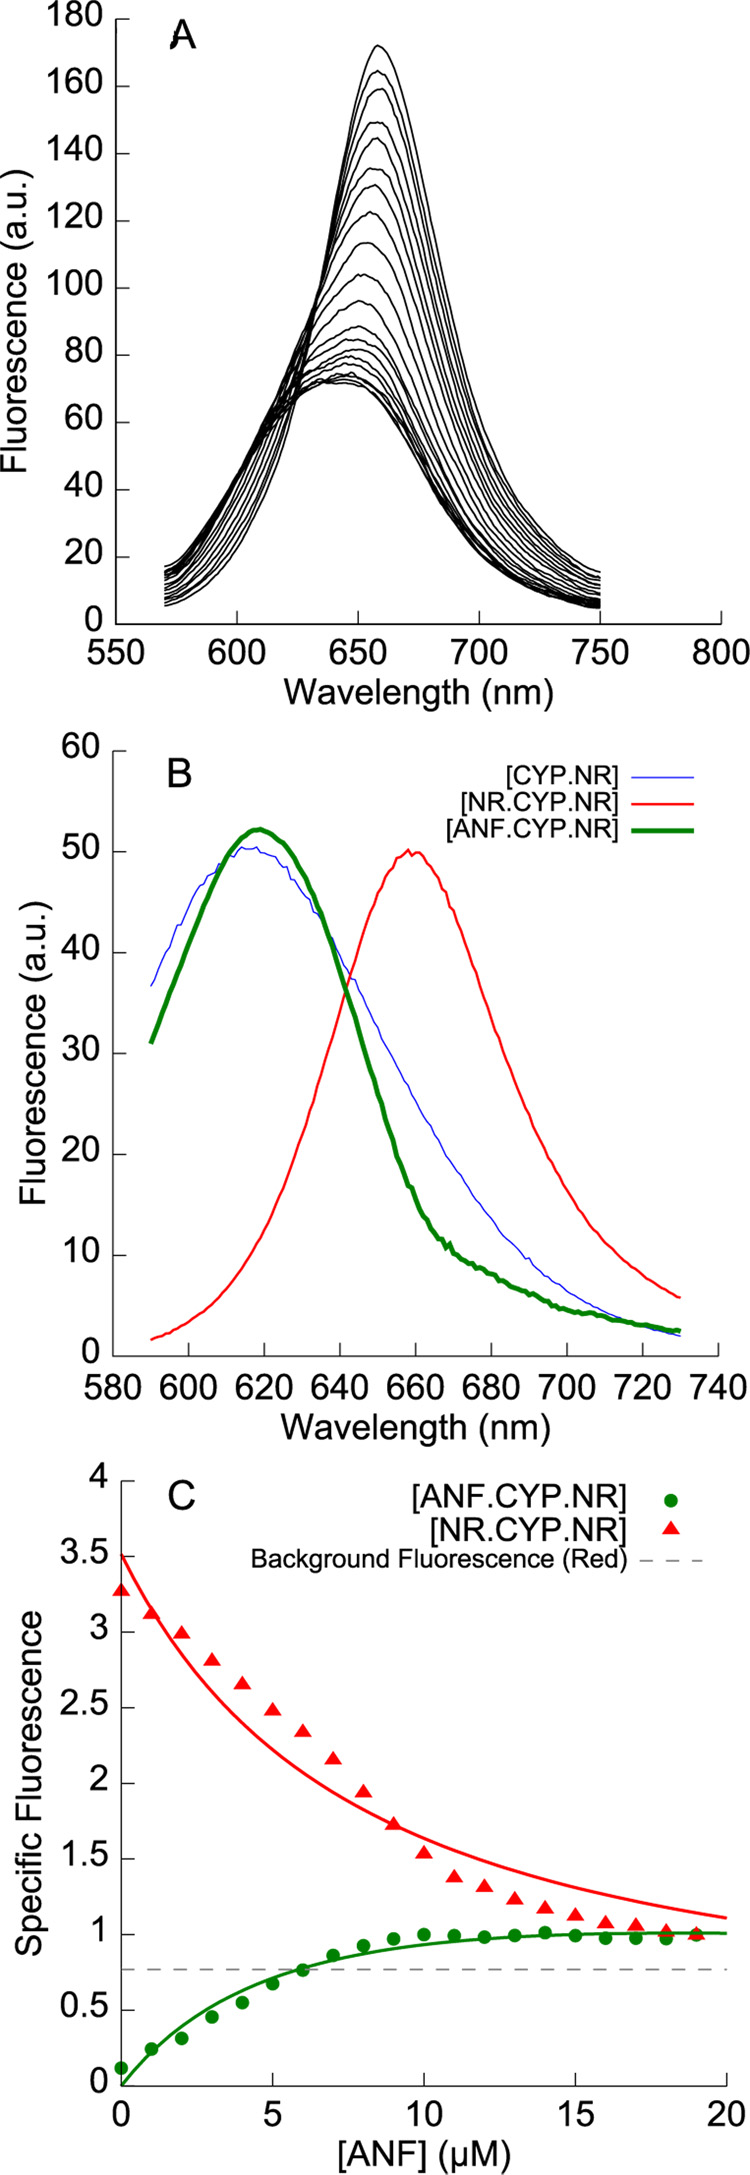
Figure 5.
A. Fluorescence emission spectra when α-naphthoflavone (0 to 19 µM) is titrated into a preformed complex of 1 µM CYP3A4 and 5 µM Nile Red. ANF displaces one molecule of Nile Red from NR•CYP3A4•NR, to form a mixed ANF•CYP3A4•NR complex. B. The basis spectrum for ANF•CYP3A4•NR (green line) shows a blue-shifted species with a markedly sharper emission peak than CYP3A4•NR. C. Deconvolution of the data in A showing the decrease in NR•CYP3A4•NR and the increase in ANF•CYP3A4•NR, fit to a model (solid lines) where ANF and Nile Red compete for a high-affinity effector site.

