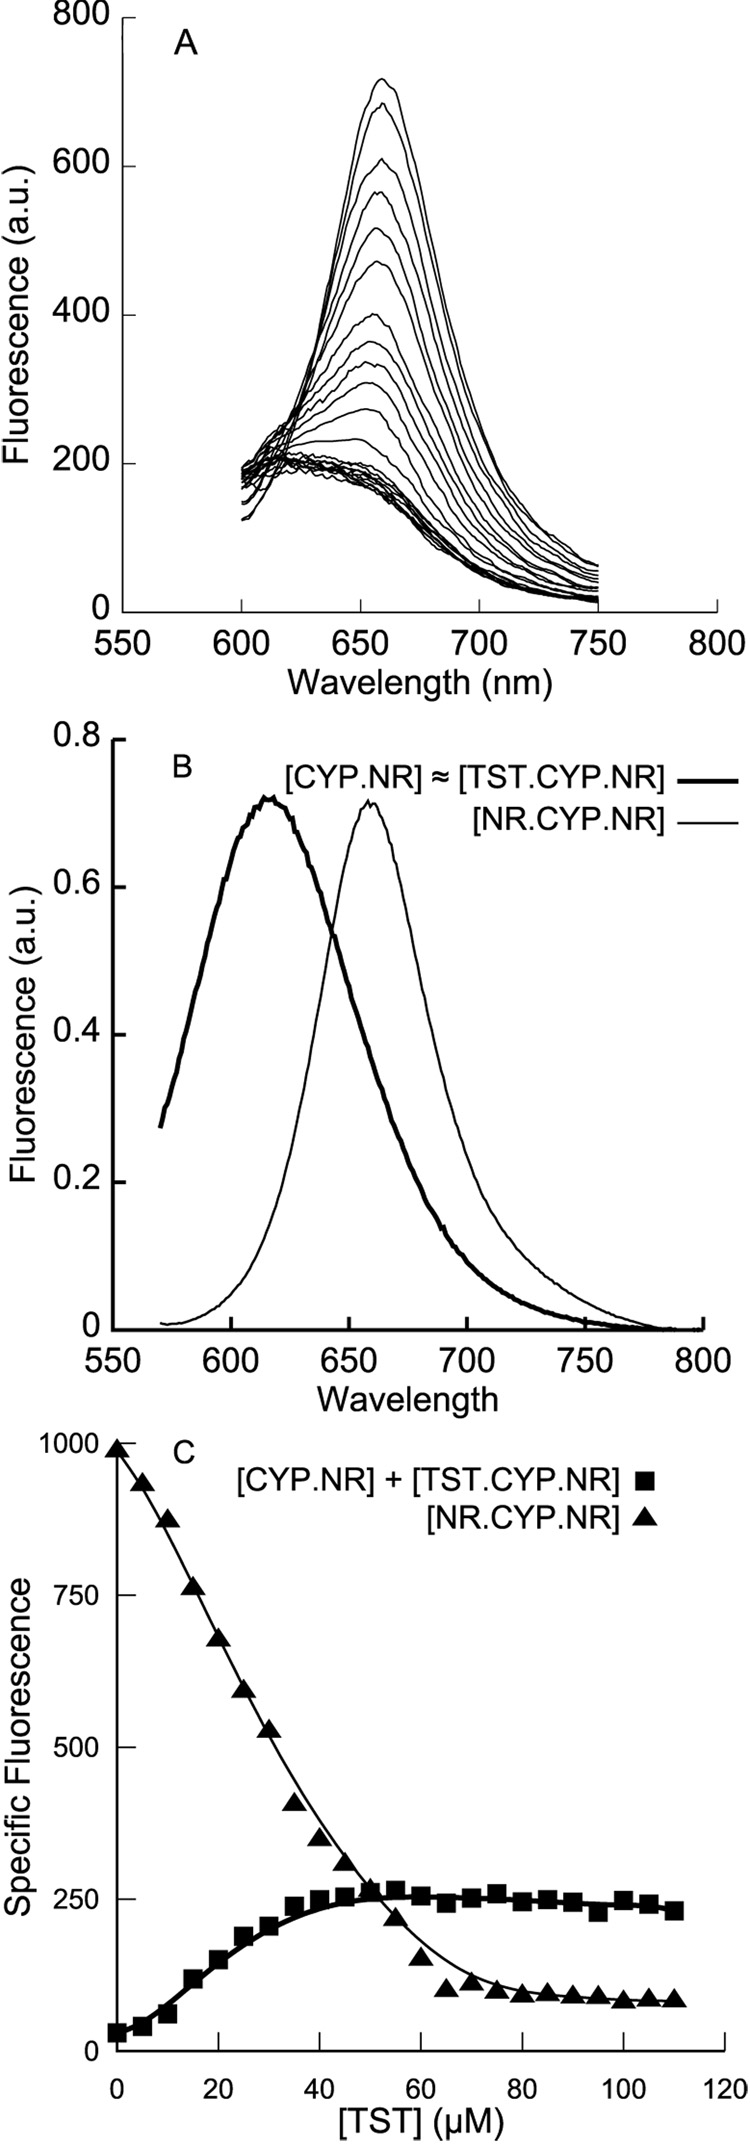
Figure 6.
A. Fluorescence emission spectra when testosterone (0 to 110 µM) is titrated into a preformed complex of 1 µM CYP3A4 and 3 µM Nile Red. A decrease in red specific fluorescence is coupled with an increase in blue specific fluorescence. B. The putative TST•CYP3A4•NR heterocomplex is spectrally indistinguishable from CYP3A4•NR, and so spectral deconvolution was performed using the same two basis spectra as shown in Figure 3A. C. Deconvolution of the data in A shows that the apparent KD is in the 20 to 40 µM range, but the two-site competitive model proposed for ANF does not adequately fit these data. Since at least three TST molecules are known to bind CYP3A4 in this concentration regime, the additional complexity may be due to quaternary complexes of CYP3A4 and three ligand molecules. Fits of such complex models to the data in A are overparametrized, and cannot be meaningfully compared; solid lines are shown solely as guides to the eye.

