
Fig. 6.
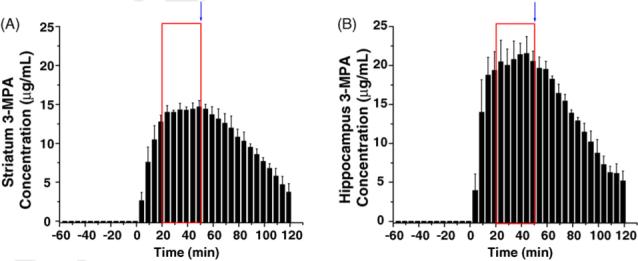
Brain concentration vs. time profiles for constant infusion dosing of 3-MPA measured from the striatum and hippocampus simultaneously (n = 3 rats). The 3-MPA was administered at t = 0 min. Boxes represent the time in which a steady-state concentration of 3-MPA was achieved in each region. The arrow represents the time in which the infusion was stopped.