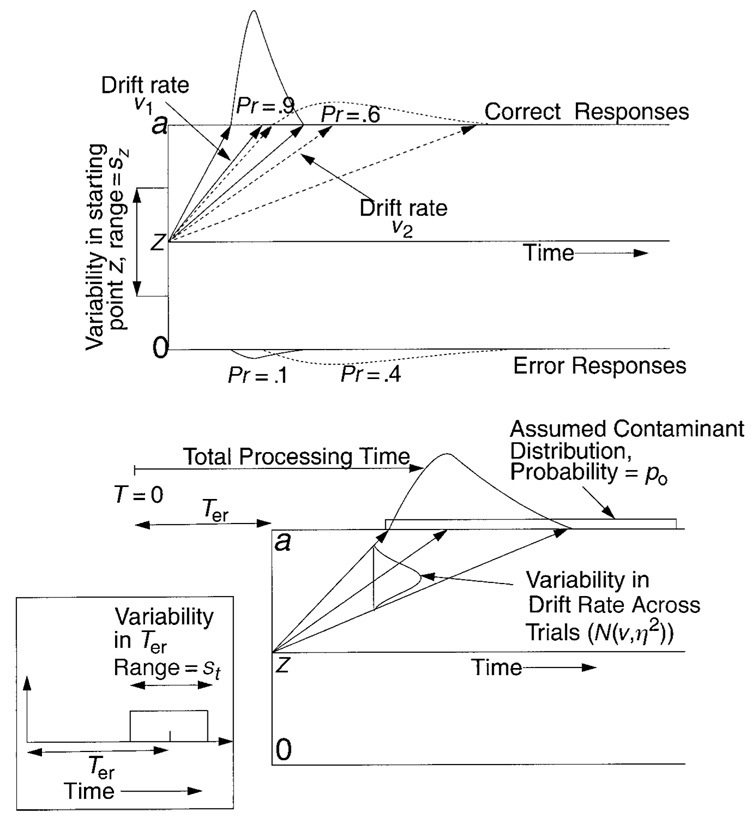
Figure 1.
An illustration of the diffusion model and parameters. The top panel shows starting point variability and illustrates how accuracy and reaction time distribution shapes for correct and error responses change as a function of two different drift rates (v1 and v2). The bottom right panel illustrates variability in drift across trials (standard deviation η) and the distribution of contaminants. The bottom left panel shows variability in Ter, the nondecision component of reaction time.

